Page 1 of 2
Carbon Dioxide over Time Chart
Posted: Mon Jan 09, 2017 6:10 pm
by JohnStOnge
I spent a LITTLE time looking for a previous Climate Change thread but I'm not good at that stuff and don't want to spend much time so I'll just post it here. Found this graph in a Columbia University Lecture at
http://rainbow.ldeo.columbia.edu/course ... rthcy6.htm:
Lecture caption:
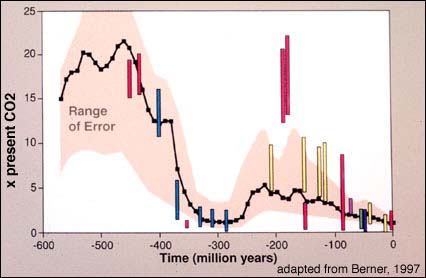
The above figure shows Phanerozoic CO2 levels. The curve represents the results of a geochemical model of CO2 and the bars are the range of paleo-CO2 measurements based on soil calcium carbonate.
Actually I've seen the line that's the model output in a lot of places but I figure if it's in a Columbia lecture I can point to it and most people will believe it. The black line is the ratio of carbon dioxide in the atmosphere to the level when the line was generated (1997). That's why you see it at 1 at the 0 years ago mark. I've seen subsequent versions and it looks pretty much the same.
Bottom line: Carbon dioxide in the atmosphere is close to as low as it's ever been over the past 500+ million years. Also a pretty good bit lower than it's been during the overwhelming preponderance of the Age of Mammals; which began about 65 million years ago.
Just a little perspective.
Re: Carbon Dioxide over Time Chart
Posted: Mon Jan 09, 2017 6:16 pm
by kalm
Link not found.
Re: Carbon Dioxide over Time Chart
Posted: Mon Jan 09, 2017 6:21 pm
by CID1990
Of COURSE CO2 is at very low levels compared with the lifespan of the earth.
The earth was a different planet once you go back past 400 million years. In fact, the earth would have been as alien to us as Mars, and the air poisonous.
It's an interesting graph, but immaterial to the arguments over AGW.
Re: Carbon Dioxide over Time Chart
Posted: Mon Jan 09, 2017 8:29 pm
by JohnStOnge
CID1990 wrote:Of COURSE CO2 is at very low levels compared with the lifespan of the earth.
The earth was a different planet once you go back past 400 million years. In fact, the earth would have been as alien to us as Mars, and the air poisonous.
It's an interesting graph, but immaterial to the arguments over AGW.
The graph doesn't show the history of the earth. The earth is about 4.5 billion years old. The graph just shows the most recent 580 million or so. And there was a lot of life during a lot of that 500 million years. It's believed that amphibians invaded land about 370 million years ago. The Carbiniferous period oxygen levels around 300 million years ago were significantly higher than they are now. The age of dinosaurs was from around 200 to 65 million years ago. We would've done fine with breathing the atmosphere during all of that time. And it continued into the age of mammals that started around 65 million years ago. Mammals continued to do well during the 60 plus million year since then even though C02 levels were much higher than they are now during almost all of that time.
Re: Carbon Dioxide over Time Chart
Posted: Mon Jan 09, 2017 8:53 pm
by Skjellyfetti
Hmmm.
I thought it was only science if evidence could be directly measured and tested through experimentation.
These CO2 levels are all
estimated using models.
Interesting you can pick and choose when to be an autist.

Re: Carbon Dioxide over Time Chart
Posted: Mon Jan 09, 2017 10:39 pm
by JohnStOnge
Skjellyfetti wrote:Hmmm.
I thought it was only science if evidence could be directly measured and tested through experimentation.
These CO2 levels are all
estimated using models.
Interesting you can pick and choose when to be an autist.
No I agree with you. It's what's believed to have happened. That particular graph comes at it from two different angles. It's got the model estimate and it's got estimates based on proxy data. Both paint the same basic picture.
The thing is that the same people who tell you we are facing disaster because of CO2 levels also believe the basic picture depicted by that black line generated by the model. If you ask them if CO2 levels were higher during most of the Age of Mammals to this point than they are now they're going to say "yes."
Re: Carbon Dioxide over Time Chart
Posted: Mon Jan 09, 2017 11:33 pm
by ALPHAGRIZ1
kalm wrote:Link not found.
It doesnt matter if you found a link or not, the scientists that were measuring all the Carbon Dioxide levels 3 million years ago are dead..........................
Re: Carbon Dioxide over Time Chart
Posted: Tue Jan 10, 2017 3:20 am
by houndawg
JohnStOnge wrote:I spent a LITTLE time looking for a previous Climate Change thread
but I'm not good at that stuff and don't want to spend much time so I'll just post it here. Found this graph in a Columbia University Lecture at
http://rainbow.ldeo.columbia.edu/course ... rthcy6.htm:
Lecture caption:
The above figure shows Phanerozoic CO2 levels. The curve represents the results of a geochemical model of CO2 and the bars are the range of paleo-CO2 measurements based on soil calcium carbonate.
Actually I've seen the line that's the model output in a lot of places but I figure if it's in a Columbia lecture I can point to it and most people will believe it. The black line is the ratio of carbon dioxide in the atmosphere to the level when the line was generated (1997). That's why you see it at 1 at the 0 years ago mark. I've seen subsequent versions and it looks pretty much the same.
Bottom line: Carbon dioxide in the atmosphere is close to as low as it's ever been over the past 500+ million years. Also a pretty good bit lower than it's been during the overwhelming preponderance of the Age of Mammals; which began about 65 million years ago.
Just a little perspective.
yes, we've noticed.
You need to change your act too. Your butthurt over the election kind of spoiled your scientific evangelical gig. You want to impress, tell us about the greatness of Trump vs. Hillary's trip to the rubbish heap of history.

Now be a good fellow and run along
Re: Carbon Dioxide over Time Chart
Posted: Tue Jan 10, 2017 3:27 am
by houndawg
JohnStOnge wrote:CID1990 wrote:Of COURSE CO2 is at very low levels compared with the lifespan of the earth.
The earth was a different planet once you go back past 400 million years. In fact, the earth would have been as alien to us as Mars, and the air poisonous.
It's an interesting graph, but immaterial to the arguments over AGW.
The graph doesn't show the history of the earth. The earth is about 4.5 billion years old. The graph just shows the most recent 580 million or so. And there was a lot of life during a lot of that 500 million years. It's believed that amphibians invaded land about 370 million years ago. The Carbiniferous period oxygen levels around 300 million years ago were significantly higher than they are now. The age of dinosaurs was from around 200 to 65 million years ago. We would've done fine with breathing the atmosphere during all of that time. And it continued into the age of mammals that started around 65 million years ago. Mammals continued to do well during the 60 plus million year since then even though C02 levels were much higher than they are now during almost all of that time.

You can't go back after your meltdown about Hillary, John. Things are different now - your schtick is dated and feeble. How's the missus warming up to the Trumper? Will it cause friction when he wins her over like he won over the rest of the evangelical vote?
Re: Carbon Dioxide over Time Chart
Posted: Tue Jan 10, 2017 4:22 am
by 93henfan
Damn HD, you're only supposed to use one barrel at a time.

Re: Carbon Dioxide over Time Chart
Posted: Tue Jan 10, 2017 4:52 am
by houndawg
93henfan wrote:Damn HD, you're only supposed to use one barrel at a time.
At my age you don't have time to conserve ammo..

Re: Carbon Dioxide over Time Chart
Posted: Wed Jan 11, 2017 2:50 pm
by Grizalltheway
houndawg wrote:JohnStOnge wrote:
The graph doesn't show the history of the earth. The earth is about 4.5 billion years old. The graph just shows the most recent 580 million or so. And there was a lot of life during a lot of that 500 million years. It's believed that amphibians invaded land about 370 million years ago. The Carbiniferous period oxygen levels around 300 million years ago were significantly higher than they are now. The age of dinosaurs was from around 200 to 65 million years ago. We would've done fine with breathing the atmosphere during all of that time. And it continued into the age of mammals that started around 65 million years ago. Mammals continued to do well during the 60 plus million year since then even though C02 levels were much higher than they are now during almost all of that time.
You can't go back after your meltdown about Hillary, John. Things are different now - your schtick is dated and feeble. How's the missus warming up to the Trumper? Will it cause friction when he wins her over like he won over the rest of the evangelical vote?
I can't believe she lets him get away with suggesting that the world is more than 6,000 years old.

Re: Carbon Dioxide over Time Chart
Posted: Wed Jan 11, 2017 3:49 pm
by kalm
JohnStOnge wrote:CID1990 wrote:Of COURSE CO2 is at very low levels compared with the lifespan of the earth.
The earth was a different planet once you go back past 400 million years. In fact, the earth would have been as alien to us as Mars, and the air poisonous.
It's an interesting graph, but immaterial to the arguments over AGW.
The graph doesn't show the history of the earth. The earth is about 4.5 billion years old. The graph just shows the most recent 580 million or so. And there was a lot of life during a lot of that 500 million years. It's believed that amphibians invaded land about 370 million years ago. The Carbiniferous period oxygen levels around 300 million years ago were significantly higher than they are now. The age of dinosaurs was from around 200 to 65 million years ago. We would've done fine with breathing the atmosphere during all of that time. And it continued into the age of mammals that started around 65 million years ago. Mammals continued to do well during the 60 plus million year since then even though C02 levels were much higher than they are now during almost all of that time.
How do you know we would have done fine with the atmosphere the dinosaurs breathed? Much less the world in general? Weren't mammals fairly small and getting there ass kicked??
Re: Carbon Dioxide over Time Chart
Posted: Wed Jan 11, 2017 5:26 pm
by houndawg
kalm wrote:JohnStOnge wrote:
The graph doesn't show the history of the earth. The earth is about 4.5 billion years old. The graph just shows the most recent 580 million or so. And there was a lot of life during a lot of that 500 million years. It's believed that amphibians invaded land about 370 million years ago. The Carbiniferous period oxygen levels around 300 million years ago were significantly higher than they are now. The age of dinosaurs was from around 200 to 65 million years ago. We would've done fine with breathing the atmosphere during all of that time. And it continued into the age of mammals that started around 65 million years ago. Mammals continued to do well during the 60 plus million year since then even though C02 levels were much higher than they are now during almost all of that time.
How do you know we would have done fine with the atmosphere the dinosaurs breathed? Much less the world in general? Weren't mammals fairly small and getting there ass kicked??
We are the descendants of egg snatchers.
Re: Carbon Dioxide over Time Chart
Posted: Wed Jan 11, 2017 7:21 pm
by YoUDeeMan
kalm wrote:
How do you know we would have done fine with the atmosphere the dinosaurs breathed? Much less the world in general? Weren't mammals fairly small and getting there ass kicked??
* their
Re: Carbon Dioxide over Time Chart
Posted: Wed Jan 11, 2017 7:31 pm
by Chizzang
A while back John was arguing with me how (potentially) inaccurate Carbon Dating was...
And it only looks back about 50,000 years

Re: Carbon Dioxide over Time Chart
Posted: Thu Jan 12, 2017 3:53 am
by houndawg
JohnStOnge wrote:CID1990 wrote:Of COURSE CO2 is at very low levels compared with the lifespan of the earth.
The earth was a different planet once you go back past 400 million years. In fact, the earth would have been as alien to us as Mars, and the air poisonous.
It's an interesting graph, but immaterial to the arguments over AGW.
The graph doesn't show the history of the earth.
The earth is about 4.5 billion years old. The graph just shows the most recent 580 million or so. And there was a lot of life during a lot of that 500 million years. It's believed that amphibians invaded land about 370 million years ago. The Carbiniferous period oxygen levels around 300 million years ago were significantly higher than they are now. The age of dinosaurs was from around 200 to 65 million years ago. We would've done fine with breathing the atmosphere during all of that time. And it continued into the age of mammals that started around 65 million years ago. Mammals continued to do well during the 60 plus million year since then even though C02 levels were much higher than they are now during almost all of that time.
Bullshit.
Does your wife know where you are?

Re: Carbon Dioxide over Time Chart
Posted: Thu Jan 12, 2017 3:56 am
by houndawg
Chizzang wrote:A while back John was arguing with me how (potentially) inaccurate Carbon Dating was...
And it only looks back about 50,000 years
Hard times for the evangelical scientist...

Re: Carbon Dioxide over Time Chart
Posted: Thu Jan 12, 2017 6:57 am
by andy7171
So 600 million years ago the earth was uninhabitable!?! Go figure!
Re: Carbon Dioxide over Time Chart
Posted: Thu Jan 12, 2017 9:13 am
by Chizzang
houndawg wrote:Chizzang wrote:A while back John was arguing with me how (potentially) inaccurate Carbon Dating was...
And it only looks back about 50,000 years
Hard times for the evangelical scientist...
I feel for him
It's a tough balancing act - to span the gap - between bat sh!t crazy and Captain Obvious
Re: Carbon Dioxide over Time Chart
Posted: Thu Jan 12, 2017 9:58 am
by Ibanez
I'm confused, is this how much hot air you expend bloviating about Trump?
Re: Carbon Dioxide over Time Chart
Posted: Thu Jan 12, 2017 6:05 pm
by houndawg
Chizzang wrote:houndawg wrote:
Hard times for the evangelical scientist...
I feel for him
It's a tough balancing act - to span the gap - between bat sh!t crazy and Captain Obvious
He did about as well as you can until the election came along... poor bastard.
Re: Carbon Dioxide over Time Chart
Posted: Fri Jan 13, 2017 9:58 am
by CID1990
JohnStOnge wrote:CID1990 wrote:Of COURSE CO2 is at very low levels compared with the lifespan of the earth.
The earth was a different planet once you go back past 400 million years. In fact, the earth would have been as alien to us as Mars, and the air poisonous.
It's an interesting graph, but immaterial to the arguments over AGW.
The graph doesn't show the history of the earth. The earth is about 4.5 billion years old. The graph just shows the most recent 580 million or so. And there was a lot of life during a lot of that 500 million years. It's believed that amphibians invaded land about 370 million years ago. The Carbiniferous period oxygen levels around 300 million years ago were significantly higher than they are now. The age of dinosaurs was from around 200 to 65 million years ago. We would've done fine with breathing the atmosphere during all of that time. And it continued into the age of mammals that started around 65 million years ago. Mammals continued to do well during the 60 plus million year since then even though C02 levels were much higher than they are now during almost all of that time.
I know how old the earth is.
And I said, "when you go back PAST 400 million years"
Re: Carbon Dioxide over Time Chart
Posted: Fri Jan 13, 2017 11:01 am
by Chizzang
CID1990 wrote:JohnStOnge wrote:
The graph doesn't show the history of the earth. The earth is about 4.5 billion years old. The graph just shows the most recent 580 million or so. And there was a lot of life during a lot of that 500 million years. It's believed that amphibians invaded land about 370 million years ago. The Carbiniferous period oxygen levels around 300 million years ago were significantly higher than they are now. The age of dinosaurs was from around 200 to 65 million years ago. We would've done fine with breathing the atmosphere during all of that time. And it continued into the age of mammals that started around 65 million years ago. Mammals continued to do well during the 60 plus million year since then even though C02 levels were much higher than they are now during almost all of that time.
I know how old the earth is.
And I said, "when you go back PAST 400 million years"
Anything pre-dating the bible - we can only hypothesize on it's age...
Because the Bible is focused on the truth and scientist are a bunch of liars

Re: Carbon Dioxide over Time Chart
Posted: Sat Jan 14, 2017 9:46 am
by SDHornet
93henfan wrote:Damn HD, you're only supposed to use one barrel at a time.
This was the best knee capping I've seen houndy ever pull off. Well done Houndy.
