

Lecture caption:
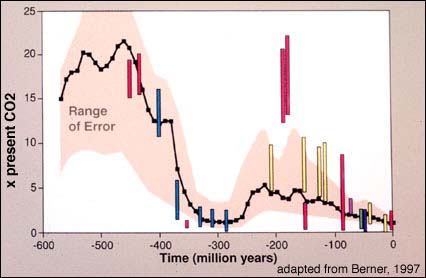
Actually I've seen the line that's the model output in a lot of places but I figure if it's in a Columbia lecture I can point to it and most people will believe it. The black line is the ratio of carbon dioxide in the atmosphere to the level when the line was generated (1997). That's why you see it at 1 at the 0 years ago mark. I've seen subsequent versions and it looks pretty much the same.The above figure shows Phanerozoic CO2 levels. The curve represents the results of a geochemical model of CO2 and the bars are the range of paleo-CO2 measurements based on soil calcium carbonate.
Bottom line: Carbon dioxide in the atmosphere is close to as low as it's ever been over the past 500+ million years. Also a pretty good bit lower than it's been during the overwhelming preponderance of the Age of Mammals; which began about 65 million years ago.
Just a little perspective.